As the U.S. military stands prepared to respond to emerging threats and remains deployed
throughout the world, our adversaries are employing sophisticated capabilities, including testing
nuclear weapons, utilizing chemical weapons and deploying stronger and more advanced explosives. The U.S. government, including the departments of Defense and Energy, employ spacebased detection capabilities to support identification, location and strength of explosive events. Detection via ionospheric disruption through Global Navigation Satellite System (GNSS) stations could potentially augment the Department of Defense’s (DoD) current capabilities for technical intelligence and battlespace awareness.
The ionosphere is a layer of Earth’s upper atmosphere in which electron density varies based on the sun’s diurnal cycle. This atmospheric layer affects radio signals utilized on Earth for communication and navigation, such as those used by GPS. Acoustic, gravity and acoustic-gravity waves are generated by natural Earth activities, such as geomagnetic storms, earthquakes, tsunamis and volcanic eruptions, as well as artificially conducted events like large-scale explosions. [1,2,3,4,5] These waves take on variable shapes and properties based on the nature of their source. The waveforms then propagate to upper atmospheric regions where they change the distribution of electron density in the ionosphere,
driving irregularities referred to as traveling ionospheric disturbances (TID), typically at mid latitudes. TIDs can be extracted by observing the spatio-temporal variation of the electron density in the ionosphere.
The DoD could potentially utilize the GNSS alongside existing platforms to improve precision monitoring of anthropogenic events by measuring total electron contents (TEC) along ray paths using the refractive property of signals in the ionosphere. [4,6,7] From the observed TEC on GNSS signals, the abnormal fluctuation due to the geophysical activities can be extracted. TIDs can be isolated after
removing major TEC trends such as the sun’s diurnal cycle and changing satellite geometry. Numerous studies have applied the GNSS technique to observe natural or artificial events by monitoring
the ionospheric state [4,5,8,9,10], and this technique has become a staple of ionospheric research. In practice, relating a TID wave to a specific event is not straightforward because numerous
events can generate disturbances in the ionosphere, and the background noise f the ionosphere increases the level of difficulty. Hence, the below research provides the DoD the process to detect TID
wave properties individually but also its propagation pattern using multiple adjacent GNSS network stations to identify these explosive events. This article presents experiments of mapping and analyzing TIDs generated by acoustic-gravity waves from anthropogenic events, including underground nuclear explosions (UNE), mine collapses, mine blasts and large chemical explosions (LCE), and how
this technology could augment current capabilities and support future military/DoD deployments.
TID Detection
With the refractive property of GNSS signals through the ionosphere, the TEC along the GNSS ray path can be precisely measured by taking the geometry-free (GF) linear combination in Equation 1
using two or more different frequency signals. The GF observation between a station (i) and a satellite (k) is described by Equation 1 on the following page.
where Φ_(i,GF)^k is the GF observation at a station (i) observing a satellite (k) from dual frequency GPS signals L1 and L2 with respective frequencies (f1 and f2), I_(i,1)^kis the ionospheric delay on the L1- signal; β is a constant bias over a continuous data span, and ε is the observational noise. [10]
The ionospheric delay, I_(i,1)^k in Equation 1, can be converted to slant TEC (STEC), [11] where STEC_i^k is the STEC along the ray path between GNSS receiver (i) and GNSS
satellite (k). [10]
Under normal conditions, the STEC observation is expected to smoothly change with the sun’s diurnal motion and the satellite-to-receiver geometry. The STEC observation also includes tropospheric error,
clock jitter, multipath error, constant bias term and other errors. To minimize these effects and better isolate possible TIDs, the numerical derivative method [5] is applied. The numerical derivative method is computed using three consecutive data points and acts as a kind of high-pass filter. Specifically, by taking the third order numerical derivatives of the continuous ray path data span, possible short-period (on the order of a few minutes) TID candidates can be identified, and they are confirmed by visual inspection and cross-covariance analysis. [5,10,12]
Figure 1 shows the gradual filtering process of original STEC in (a) to isolate TID candidates as shown in (d) by increasing the order of numerical derivatives.
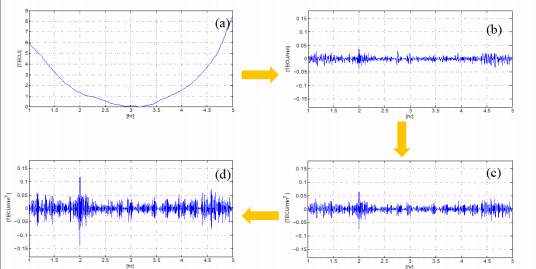
Figure 1: Numerical derivatives of STEC data span; (a) STEC, (b) the first order derivatives of STEC, (c) the second order derivatives of STEC,
(d) the third order derivatives of STEC. (Released)
In (a), a dominant trend is found in the STEC data span that is mainly due to both the geometry change of a satellite and the sun’s diurnal motion. The main trend is sufficiently removed by taking the numerical derivatives using a sliding window, while the other effects from various error sources
within the GNSS signal exist in (b). When the higher order filters were applied, some distinguishable peaks remained in (d) that are the candidate TID waves TIDs can be excited by various sources. In other words, the selected TID candidate is not necessarily from a certain event of interest. Consequently, careful analysis is required to isolate meaningful TIDs associated with a target event and to discriminate TIDs from different event types. One strategy to relate candidate TIDs to a specific event is the observation of the propagation velocity from the point source. Selecting appropriate TIDs is based on the apparent propagation of the signals. In particular, we focused on TID propagation velocities ranging roughly between a few hundred meters per second to about 1 kilometer per second to mark possible TIDs from high-energy point source events like explosions and mine collapses. [13,14]
Figure 2 presents examples of TID propagation after two U.S. UNEs in 1992, Hunters Trophy and Divider. [12] The travel distance of TID is the slant distance between the location of the UNE and the ionospheric pierce point of the GNSS ray path at the moment of TID peak appearance. Considering the constant propagation velocity of TIDs from a point source, the detected TIDs, which form a linear model for travel time-distance, are regarded as the TIDs associated with the point source. The set of TIDs which satisfy this condition is an array signature for a specific event.
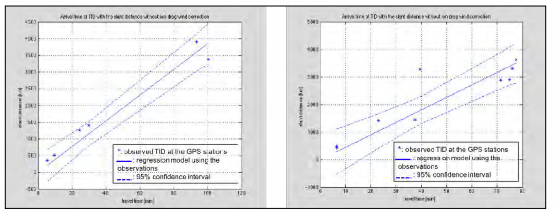
Figure 2: Linear model of TID travel time and distance plots of U.S. UNEs in 1992; Hunters Trophy (left) and Divider (right). (Regenerated from Figures 1 and 2 in [12]/Released)
Figure 3 compares three TIDs from three different sources. Within the time series plots on the left, the top plot shows a TID signature generated by the UNE in 2009. The middle plot shows a TID generated by the UNE in 2006, and the bottom plot shows a TID generated by the earthquake in 2011. The right panel shows their amplitude spectra. In this figure, some similarity between the same type of events, UNEs, and dissimilarity between two different types of events can be found in time series plots as well as the spectral analysis where the local maximum of each type of event is shown at different frequency range.
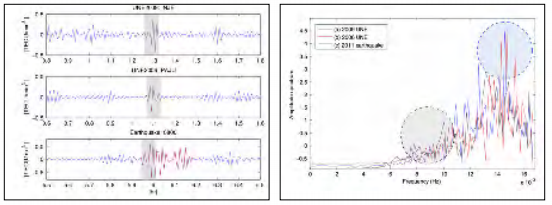
Figure 3: On the left are three time series plots illustrating the detected TID waves from the 2009 (top) and 2006 (middle) UNEs relative to those from the 2011 Tohoku earthquake (bottom). The right plot provides the amplitude spectra of these STEC derivatives. [10] (Released)
Smaller, man-made events such as mine collapses, mine blasts and large chemical explosions also generate TIDs that are detectable using this technique. The Crandall Canyon Mine collapse near Huntington in Emery County, Utah, occurred Aug. 6, 2007, at 8:48:40 Coordinated Universal Time (UTC) at geographic coordinates (39.4600° N, 111.1676° W). The mine collapse resulted in a “magnitude 3.9 mining-induced seismic event,” [15] and the reported body wave magnitude was 5.2MB.
Figure 4 shows the travel velocity of the TIDs from the Crandall Canyon Mine collapse. The left plot shows the travel time-distance curve and the right plot shows the propagation velocity of each TID by using colored symbols and the geographical locations of the mine in pink star.
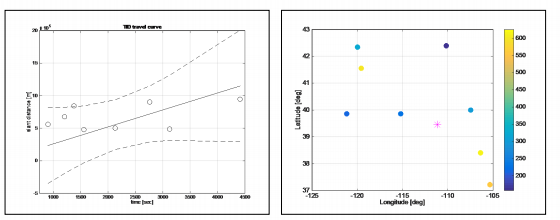
Figure 4: TID velocity propagated from the 2007 Crandall Canyon Mine collapse; travel time curve with the 99 percent confidence interval (left) and TIDs at their ionospheric pierce points (right) where the color of each dot represents its travel velocity in m/s from the color bar. The pink star indicates the location of mine collapse. (Released)
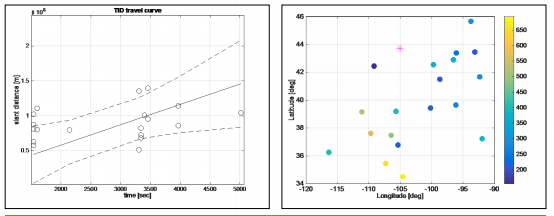
Figure 5: TID velocity propagated from the NW Wyoming mine blast in 2000; travel time curve with the 99 percent confidence interval (left) and TIDs at their IPPs (right) where the color of each dot represents its travel velocity in m/s from the color bar. The pink star indicates the location of mine collapse. (Released)
Mine blasts also release significant energy to the atmosphere. Two mine blasts in NE Wyoming were selected as case studies. On March 24, 2000, cast blasting at a NE Wyoming mine occurred at 20:04.21.89 UTC at geographic coordinates (43.721oN, 105.0549oW). In 2001, another mine blast was conducted at the same mine (L. Triplett, personal communication, May 15, 2014). The reported body-wave and local magnitudes for both events were 4.8 MB and 3.5 ML, respectively. Figures 5 and 6 show the travel velocity of TIDs from the two events.
The approximate propagation velocities of these events can be computed based on the linear model of travel time-distance on the left panel of each figure, that are 291.076 m/s (standard deviation 66.747 m/s) for the 2000 event and 226.678 m/s (standard deviation 33.441 m/s) for the 2001 event.
It should be noted that more TID waves were detected from the NE Wyoming mine blasts than the Crandall Canyon Mine collapse case with higher correlation between the travel time and travel distance of their propagation pattern. Considering the nature of these two types of events, it may be easier to detect the propagated waves emanating from mine blasts because such blasts emit energy from the ground into the air whereas the explosive energy from a mine collapse tends to be absorbed underground.
In addition to the Crandall Canyon Mine collapse and NE Wyoming mine blasts, another type of man-made event was also observed. A series of chemical explosive tests, known as the Source Physics Experiment (SPE), were conducted in the granitic rock of the Climax stock in northern Yucca Flat at the Nevada National Security Site in 2010–2011. [16] The SPE test series was designed to study the generation and propagation of seismic waves to improve the predictive capability of detecting and characterizing underground explosions. [17] As a case study, one of the events on Oct. 25, 2011, (DOY 298) was selected to monitor the TIDs from the SPE, and the result is shown in Figure 7.
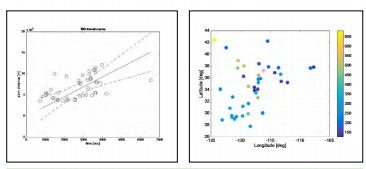
Figure 7: Travel time curve with the 99 percent confidence interval (left), and the TIDs at their IPPs (right) for the USA LCE (pink star). The dot color represents its travel velocity in m/s from the color bar. (Released)
Summary and Discussion
With the advent of GPS, or more generally the GNSS, ionospheric observations in high spatial and temporal resolutions are possible to better detect and verify the ionospheric signatures of these geophysical events. This study focused on artificially conducted anthropogenic events including UNEs, mine collapses, mine blasts and LCEs. As such, the analysis of these events could support future U.S. government research into the efficacy of this approach to augment existing U.S. government and DoD detection capabilities. Additionally, this platform and associated methodologies could provide future insights to the DoD regarding our adversaries’ testing of new capabilities and threat detection for deploying military units.
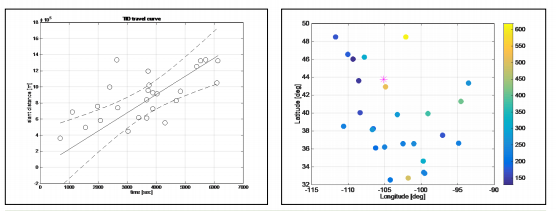
Figure 6: TID velocity propagated from the NW Wyoming mine blast in 2001; Travel time curve with the 99 percent confidence interval (left) and TIDs at their IPPs (right) where the color of each dot represents its travel velocity in m/s from the color bar. The pink star indicates the location of mine collapse. (Released)
The results of this work show the potential utility of GNSS observations for detecting and mapping the ionospheric signatures of large-energy anthropological explosions and subsurface collapses. Although this study successfully detected various types of artificial events across underground, near surface and surface explosions, the study mostly focused on the array signature of the TID propagation. In future development, additional detection and analysis approaches should be investigated for better discrimination among the types of events, as well as for constraining the poorly known properties of ionospheric winds that may affect the signatures of these events in the ionosphere.
References
- Hines, C. O. (1967). On the nature of traveling ionospheric disturbances launched by low-altitude nuclear explosions. Journal of Geophysical Research, 72(7), 1877-1882. doi:10.1029/JZ072i007p01877
- Zaslavski, Y., Parrot, M., & Blanc, E. (1998). Analysis of TEC measurements above active seismic regions. Physics of the Earth and Planetary Interiors, 105(3-4), 219-228. doi:10.1016/s0031- 9201(97)00093-9
- Artru, J., Ducic, V., Kanamori, H., Lognonne, P., & Murakami, M. (2005). Ionospheric detection of gravity waves induced by tsunamis. Geophysical Journal International, 160, 840-848. doi: 10.1111/j.1365- 246X.2005.02552.x
- Heki, K. (2006). Explosion energy of the 2004 eruption of the Asama Volcano, central Japan, inferred from ionospheric disturbances. Geophysical Research Letters, 33(14). doi:10.1029/2006GL026249
- Park, J., Frese, R. R., Grejner-Brzezinska, D. A., Morton, Y., & Gaya-Pique, L. R. (2011). Ionospheric detection of the 25 May 2009 North Korean underground nuclear test. Geophysical Research Letters, 38(22). doi:10.1029/2011gl049430
- Grejner-Brzezinska, D. A., Wielgosz, P., Kashani, I., Smith, D. A., Spencer, P. S., Robertson, D. S., & Mader, G. L. (2004). An analysis of the effects of different network-based ionosphere estimation models on rover positioning accuracy. Journal of Global Positioning Systems, 3(1-2), 115-131.
- Park, J., Sreeja, V., Aquino, M., Cesaroni, C., Spogli, L., Dodson, A., & De Franceschi, G. (2016). Performance of ionospheric maps in support of long baseline GNSS kinematic positioning at low latitudes. Radio Science, 51(5), 429-442. doi:10.1002/2015RS005933
- Fitzgerald, T. J. (1997). Observations of total electron content perturbations on GPS signals caused by a ground level explosion. Journal of Atmospheric and Solar-Terrestrial Physics, 59(7), 829-834.
- Yang, Y., Garrison, J. L., & Lee, S. (2012). Ionospheric disturbances observed coincident with the 2006 and 2009 North Korean underground nuclear tests. Geophysical Research Letters, 39(2). doi:10.1029/2011gl050428
- Park, J., Grejner-Brzezinska, D. A., Frese, R. R., & Morton, Y. J. (2014). GPS discrimination of traveling ionospheric disturbances from underground nuclear explosions and earthquakes. Journal of the Institute of Navigation, 61(2), 125-134. doi:10.1002/ navi.56
- Hofmann-Wellenhof, B., Lichtenegger, H., & Collins, J. (2001). Global Positioning System: Theory and practice (5th ed.). Springer-Verlag Wien. doi:10.1007/978-3- 7091-6199-9
- Park, J., Helmboldt, J., Grejner-Brzezinska, D. A., Frese, R. R., & Wilson, T. L. (2013). Ionospheric observations of underground nuclear explosions (UNE) using GPS and the Very Large Array. Radio Science, 48(4), 463-469. doi:10.1002/ rds.20053
- Francis, S. (1974). A theory of medium-scale traveling ionospheric disturbances. Journal of Geophysical Research, 79(34), 5245- 5260.
- Liu, J.-Y., Chen, C.-H., Lin, C.-H., Tsai, H.- F., Chen, C.-H., & Kamogawa, M. (2011). Ionospheric disturbances triggered by the 11 March 2011 M9.0 Tohoku earthquake. Journal of Geophysical Research, 116(A6). doi:10.1029/2011JA016761
- Mine Safety and Health Administration. (n.d.). Fatal accident report: Crandall Canyon Mine (p. 1, Rep. No. CAI-2007-15-17, 19-24). Arlington, VA. Retrieved from https:// arlweb.msha.gov/FATALS/2007/CrandallCanyon/FTL07CrandallCanyon.pdf (accessed April 17, 2017).
- National Security Technologies, LLC. (2014). Data release report for Source Physics Experiment 1 (SPE-1), Nevada National Security Site (DOE/NV/25946–2018). Las Vegas, NV.
- Snelson, C. M., Chipman, V. D., White, R. L., Emmitt, R. F., Townsend, M. J., Barker, D., & Lee, P. (2012). An Overview of the Source Physics Experiment at the Nevada National Security Site (SPE-N) (DOE/ NV/25946–1561). In Proceedings of the 2012 Monitoring Research Review: GroundBased Nuclear Explosion Monitoring Technologies. Albuquerque, NM


